
Another year has gone by which means it’s time for CloudKettle Year 3 by the Numbers. This is one of our favorite posts to write every year, and we hope you find the stats equally interesting. If you’re curious about how year one and two went, you can read those posts here:
CloudKettle Year 2 by the Numbers
CloudKettle Year 1 by the Numbers
CloudKettle has no investors or board to report year-end figures to or be held accountable by (which has its pros and cons). However, I think there is a lot to be gained from being transparent as an organization.
Being an analytics-focused company, every quarter we review performance (including revenue) with our internal team and some vendors. As an organization, we’re always curious about the numbers that make CloudKettle tick. Here’s a recap of what we feel are some of the most impactful numbers from our third year in business.
Sales Metrics
This year our goal was to focus our service offering. In particular, to help B2B SaaS companies optimize their Revenue Stack (more on what the Revenue Stack is here). We also aggressively pursued assisting clients with the strategy and technology behind their Sales Operations (SOPs) and Marketing Operations (MOPs). Over the last couple years, in working with our clients and talking to prospects, we realized a lot of companies were struggling with SOPs and MOPs. We have always prioritized working with clients who we feel we bring the most value to.
In 2017, this was truer than ever before.
As we sought out clients who needed help with MOPs and SOPs, we continued to turn away potential clients who weren’t a fit for us. This dedication allowed us to grow our revenue by over 600% this year.
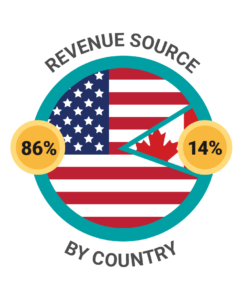
The vast majority of revenue came from work-related to the Revenue Stack (99%), from B2B SaaS organizations based in the US. Our US revenue was 86% of CloudKettle’s revenue in 2017, up from 51% in 2016.
- 2015: Revenue directly related to Salesforce or Revenue Stack work: 36%
- 2016: Revenue directly related to Salesforce or Revenue Stack work: 85%
- 2017: Revenue directly related to Salesforce or Revenue Stack work: 99%
 I like to think this niche focus is also, in part, what allows us to add so much value to our clients and build long-term relationships. In 2017, our churn rate, by revenue, was low. We, of course, lost clients over the run of the year (almost every organization does) but they represented only about 2% of our revenue.
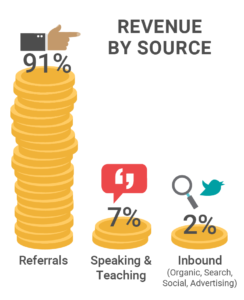
Focusing on a niche has also helped us source new clients. In 2017, 91% of CloudKettle’s business (by revenue) came from referrals. When you are a boutique like CloudKettle with a focus on delivering white glove service, you have to measure every potential client against your existing ones.
Before taking on new a client, we ask ourselves; will adopting this new client impact the level of service we provide existing clients? Will taking on this client mean we spend less time servicing clients in the space we seek to own? With that in mind, we continue to never accept more than one new client per month (and some months we don’t accept any).
As a boutique shop, each new client we work with is an important decision because it means we’re choosing not work to with another opportunity. If we have multiple opportunities, the selection criteria is based on which company we feel we can add the most value to, which company is most aligned with our passion, and which team will be the best to work with.
This process takes discipline and the willingness to sacrifice short-term revenue in favor of long-term success. It’s not easy, but has been massively beneficial for us.
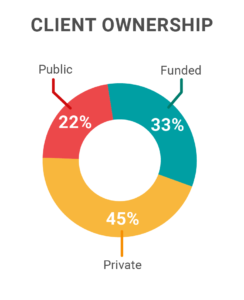
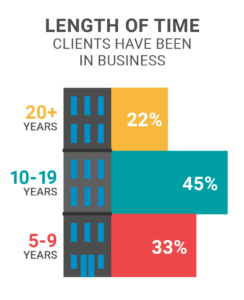
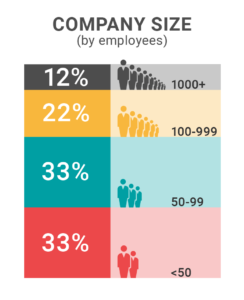
Who we Help
It was a fantastic year for CloudKettle; we have a lot to be grateful for. I am thankful for how the team has grown and the level of effort they’ve put forward this year growing our organization. 2017 was also a banner year for our clients. Two of our clients were acquired, and many reported over 100% growth rates.
Four notable client stories from 2017:
- Splunk’s stock soared over 60% in 2017 and was listed a Deloitte 2017 Technology Fast 500 company
- iWave was acquired
- Leadspace closed a 21 million dollar round
- The Herald, created Saltwire, acquiring 27 regional newspapers
This year, we also saw the age of the organizations we service and their size (by employees) grow. For the first time, we had no clients under five years of age.
Built on Trust
Again, inbound marketing was our largest lead source by a wide margin in 2017. We had some great blog posts that were widely shared, and other digital content that performed well to drive leads. In particular, a blog post on BANT (Budget, Authority, Need, Timeline) generated about 5% of all the pageviews on our site, almost all of them organic. You can check out that post here: BANT: A Dead Easy Method for Qualifying Leads.
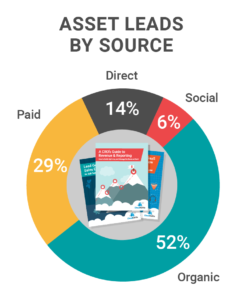
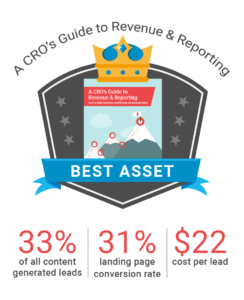
In terms of downloadable assets, our CRO ebook was the workhorse of the year. Being particularly well suited to targeted advertising on LinkedIn, its landing page had a 31% conversion rate, including paid traffic and a cost per click (CPL) of $22 (which is excellent for c-suite leads). Overall it was 33% of the content leads (form-blocked assets) CloudKettle generated in 2017.
Despite content being excellent at generating organic traffic and leads, we continued to see most of our revenue from referrals. We don’t intend that to change in the near future. For CloudKettle, the content is about walking the walk, taking the advice we give clients and also it serves as a credibility check for our prospects.
When we speak with new clients and look at our analytics, we see that story play out. A warm referral is followed by time on our website, reading content, downloading assets and then phoning us. This process extends beyond our website, through to content on other blogs, speaking at events like Dreamforce, podcasts, and our own private event in San Francisco for CROs and CMOs – the Revenue Stack Summit.
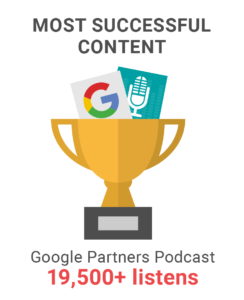
In particular, this year our best performing (by volume/reach) piece of content was our interview on the Google Partners podcast, which at the time of this posting has 19,800+ listens on SoundCloud alone (not including iTunes).
These results reinforced the benefit of focusing on a niche. The content we create is crafted for Sales and Marketing leaders at B2B SaaS companies. When they come to our site, they immediately get that we understand their space.
Travel
Every year, I hope, in my heart of hearts, to travel a little less. However, it seems unlikely to happen soon. Meeting with our clients, and speaking at events is a big part of what we do. With that in mind, here are our travel numbers this year:
-
- Number of time zones our clients are in: 5
- Number of countries our clients are founded in: 4
- Number of km travelled: 206,000 (up from 120,000 km in 2016)
- Most used airline: Air Canada
- Longest trip: Two weeks in November for Dreamforce
- Most expensive car sharing or cab: $76 (down from $94 in 2016 and up from $55 in 2015)
- Hotel nights – 117 (up from 67 in 2016)
- 62% in San Francisco (the same as in 2016)
- Most hotel nights – Club Quarters San Francisco
Teaching and Volunteering
This year we continued to teach and speak at events. In total (not including speaking engagements) we spent 24 days teaching at incubators and accelerators. In particular, with the team at Propel ICT.
We’ve also formalized our efforts to give back to the communities that have brought us here, especially our local startup ecosystem. This has included officially joining the Pledge 1% program and committing our employees to spending 1% of their workdays volunteering for nonprofits. This year we exceeded the number of hours we committed to donating by 62%. CloudKettle itself also donates 1% of its profits to charities, which the team members help select. Shout out to Kyle Cruickshanks, who volunteered the most work hours of any CloudKettler this year.
Why These Figures?
 Every year we write this post for two reasons. One, we’re a curious and numbers-focused bunch. Two, we preach transparency and this post is part of our commitment to uphold the level of transparency that we ask of others.
Some stats are very relevant to the business, others are more for curiosity – they’re things we were curious about ourselves and upon calculating them decided to share them with you.
Wondering about a number we didn’t mention? Have thoughts on our third year? Get in touch by clicking here. We’d love to hear from you.